Think Piece
Compare Commercial Solar Quotes
Prices vary wildly between providers. We’ll show you what your system should cost — or compare quotes for you.
If you’re comparing commercial solar quotes, you’ve probably already noticed something:
Prices don’t line up. At all.
One quote might be $80,000. Another is $120,000 for what looks like the same system.
So what’s going on?
In this guide, we’ll break down:
- Why commercial solar quotes vary so much
- What you should actually be paying
- How to spot overpriced or underperforming systems
If you want to skip the guesswork, you can review your quote or organise a proper comparison before making a decision.
#Why Commercial Solar Quotes Vary
There are a number of reasons why quotes can differ significantly between providers.
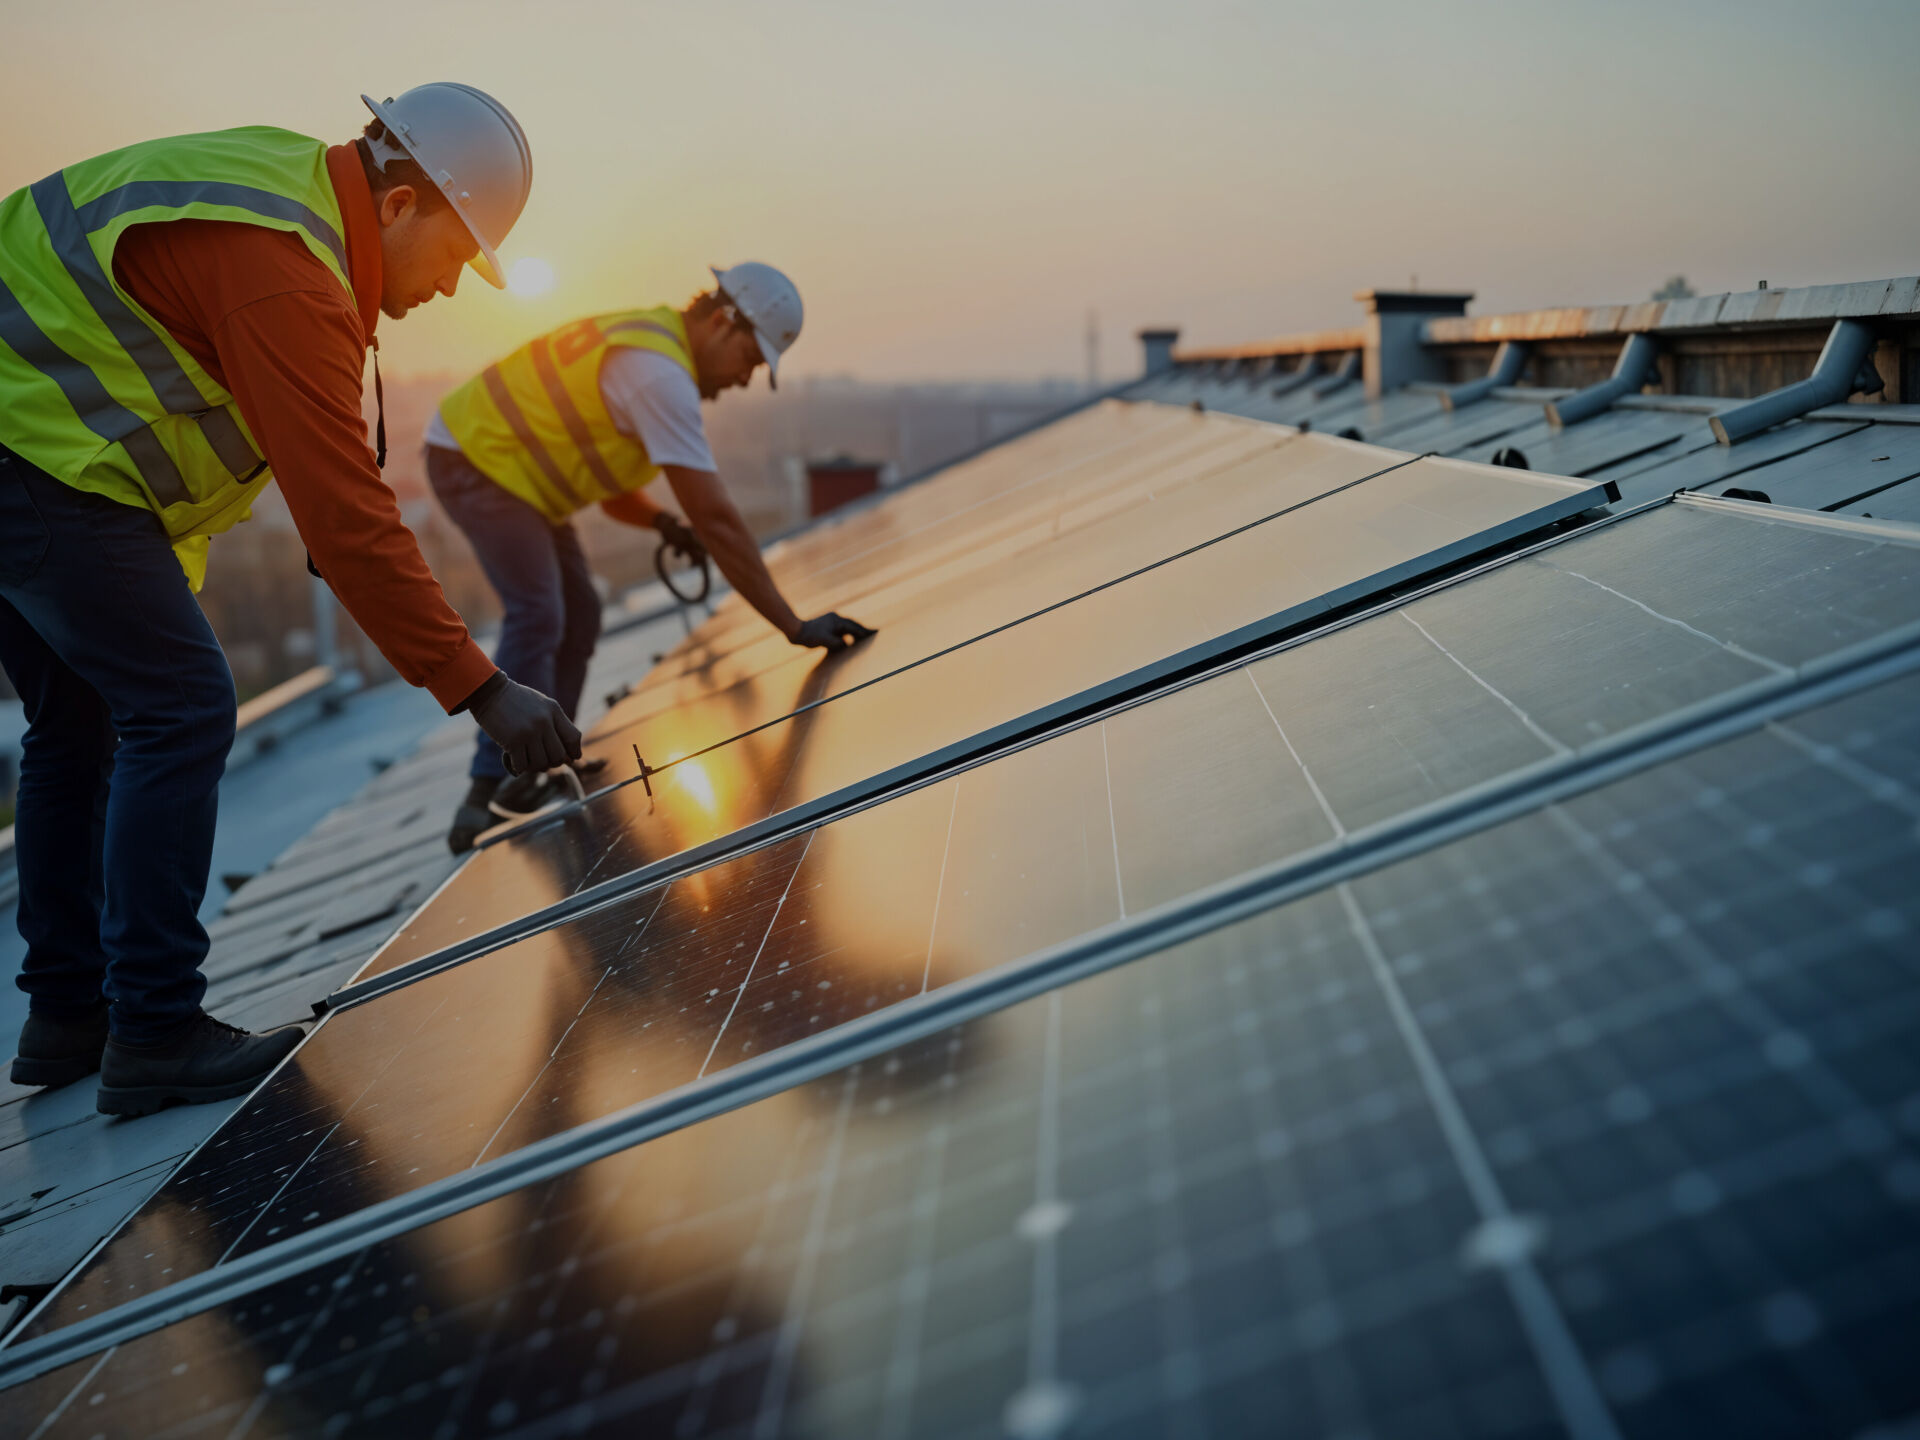
1. System Design
Not all systems are designed the same way. Panel layout, inverter selection, and overall system efficiency all impact performance — and cost.
2. Equipment Quality
Tier 1 panels and premium inverters cost more upfront but deliver better long-term performance. Cheaper components can reduce initial cost but may affect reliability and output.
3. Installation Complexity
Roof type, access, switchboard upgrades, and grid connection requirements all influence pricing.
4. Provider Margins
Some companies price aggressively low to win the job. Others build in higher margins — sometimes without delivering additional value.
5. Incentives & Assumptions
Government incentives and energy savings projections can be calculated differently, making quotes appear more attractive than they actually are.
Most businesses don’t have the time to properly compare all of this — which is why many start by comparing solar quotes before going too far down the track.
#Common Mistakes When Comparing Solar Quotes
Most businesses don’t choose the wrong system — they choose the wrong quote.
Here are some of the most common mistakes:
- Comparing price only (not performance)
- Overestimating energy savings
- Ignoring system design differences
- Choosing based on payback alone
- Not understanding what’s included
If you’re not 100% confident your quote stacks up, it’s worth taking a minute to have your quote reviewed before signing anything.
#Government Incentives And How They Impact Solar Quotes
Government incentives can significantly reduce the upfront cost of a commercial solar system.
But they’re not always applied consistently across quotes.
We often see:
- Incentives overstated
- Savings inflated
- Payback periods that don’t reflect real usage
That’s why it’s important to look beyond headline numbers and understand the true cost.
If you’re unsure, you can get an accurate breakdown of your solar pricing and incentives here.
#What A Fair Commercial Solar Quote Looks Like
While every site is different, most commercial systems fall within typical pricing ranges based on standard installations and current market conditions:
- 30kW system: approx. $35k – $55k
- 100kW system: approx. $90k – $140k
- 250kW+ systems: from $200k+
These ranges can shift depending on factors like site complexity, equipment selection, and electrical upgrades — but they’re a useful benchmark when comparing quotes.
If your quote sits well outside these ranges, there’s usually a reason — and it’s worth taking a moment to check your quote properly before moving forward.
#Finding The Right Commercial Solar System Size
Choosing the right system size is just as important as choosing the right provider.
A system that’s too small won’t maximise savings.
Too large, and you may not see the return you expect.
Your system should be based on:
- Energy usage patterns
- Load profiles
- Future growth
- Available roof space
If you’re unsure what size system is right for your business, you can get a tailored system recommendation and quote comparison based on your usage.
#Why Businesses Use Us To Compare Solar Quotes
We’re not a generic comparison site.
We design and install commercial solar systems — so we know what a good quote actually looks like.
That means:
- We know when something is overpriced
- We know when corners are being cut
- We understand real-world performance and ROI
We regularly help businesses compare commercial solar quotes and understand exactly what they’re being offered — without the sales pressure.
Still comparing quotes? Before you make a decision, it’s worth taking a second look — you can compare your quotes or upload your current proposal and we’ll help you make sense of it.#Frequently Asked Questions About Commercial Solar Quotes
In most cases, getting two to three commercial solar quotes is enough to compare system design, pricing, and assumptions. The key is understanding how each solar quote has been structured, rather than simply comparing total cost.
Commercial solar quotes can vary significantly depending on system size, equipment quality, installation scope, and how energy savings are calculated. Different assumptions around usage and pricing can make quotes look very different, even for similar systems.
When comparing commercial solar quotes, you should review system sizing, estimated energy production, equipment specifications, installation scope, and how savings and return on investment are calculated. It’s also important to check for any exclusions or additional costs.
The average cost of a commercial solar system in Australia typically ranges from $800 to $1,400 per kW installed. Pricing varies based on system size, site complexity, and equipment selection, which is why quotes can differ between providers.
Solar comparison websites can be useful for gathering multiple commercial solar quotes quickly, but they don’t always assess system design accuracy or long-term performance. It’s important to review each proposal in detail to ensure a fair comparison.


Announcement
Sharp EIT Solutions Joins Clubs QLD as a Corporate Sponsor
Supporting Queensland Clubs with Innovative Technology Solutions and Sustainable Energy
Think Piece
LED Screens for Hospitality Venues: The Best Indoor & Outdoor Options for Clubs, Pubs and Bars
Indoor & outdoor LED options for clubs, pubs, bars, RSLs and venues that need high-brightness screens built for long trading hours.